



01
Pre-application report
Weeks 1 to 3 · SunHarvest, utility responds
A paid report telling us what is already on the circuit before we commit to a design.
Circuit capacity understood before design money is spent
Commercial solar EPC since 2014
Kern County / Tulare County / Kings County / Fresno County
(661) 555-0183Commercial solar EPC, Bakersfield
 to the load,not to the roof.
Twelve months of 15-minute interval data comes before any layout. We build commercial photovoltaic and storage systems across Kern, Tulare, Kings and Fresno counties, from 80 kW DC rooftops to 5 MW DC tracker fields.
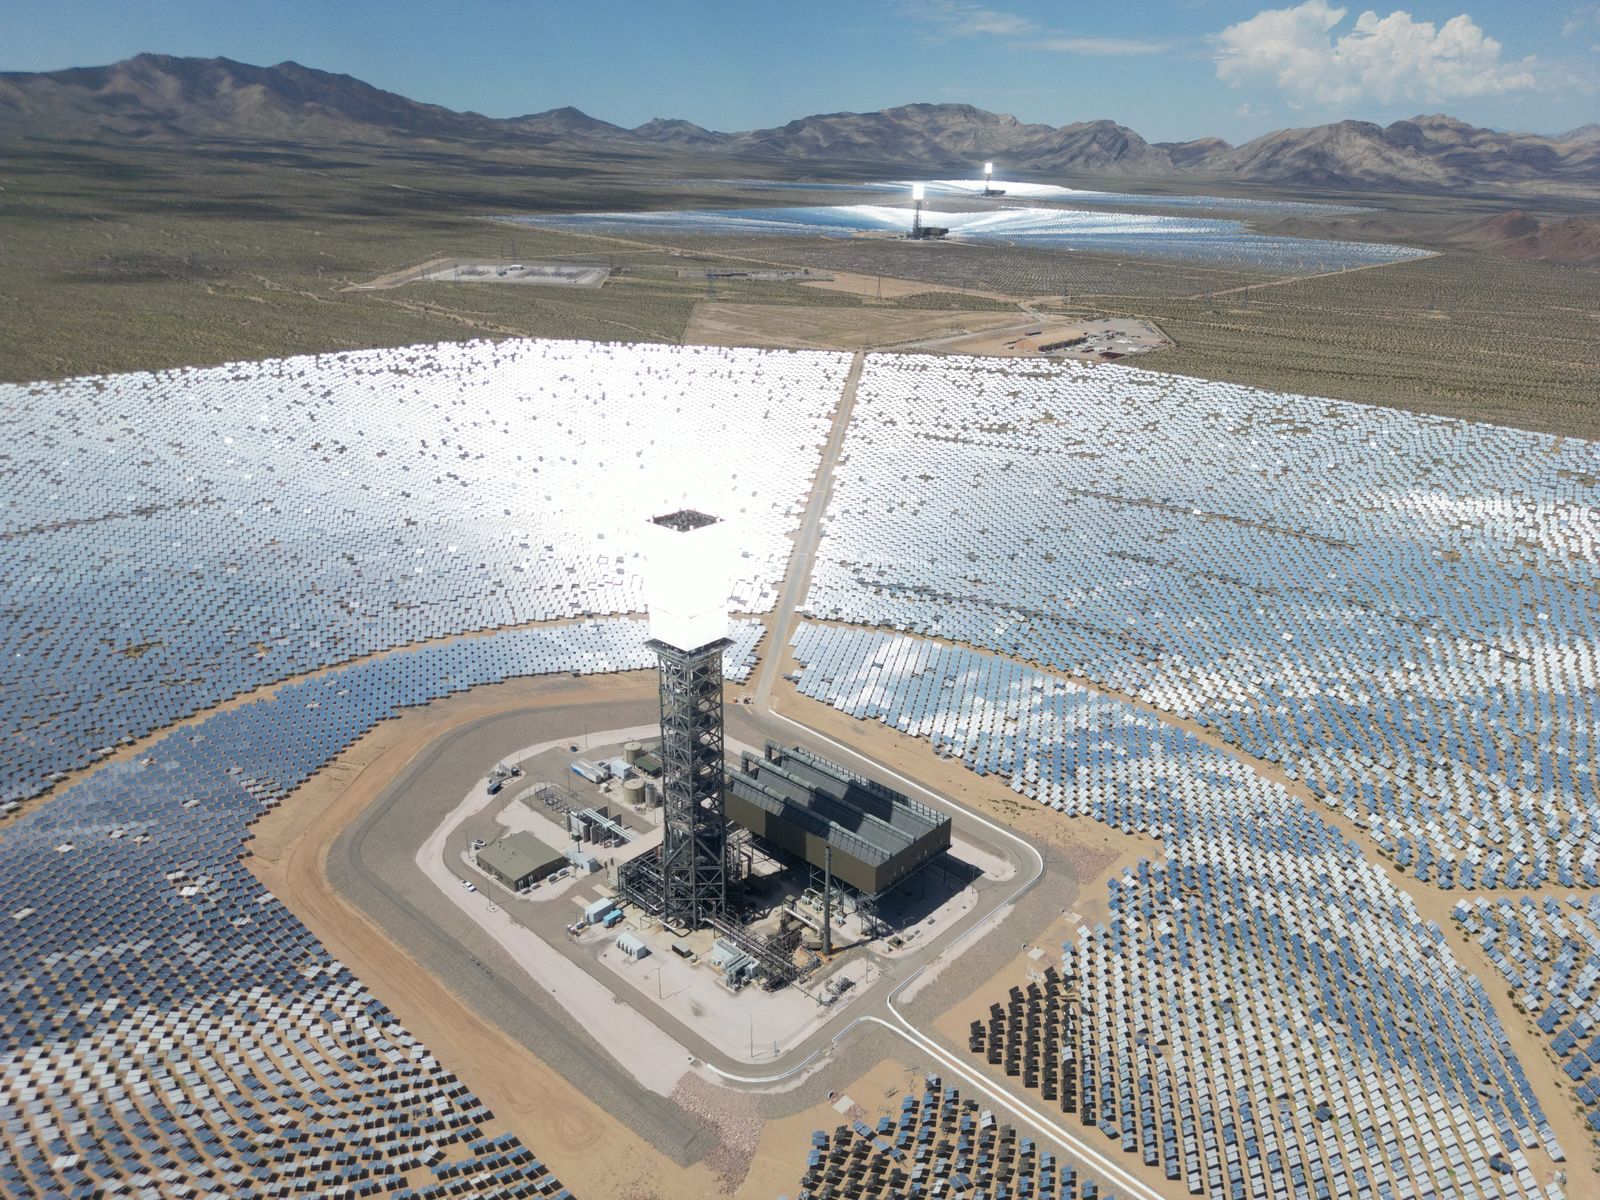
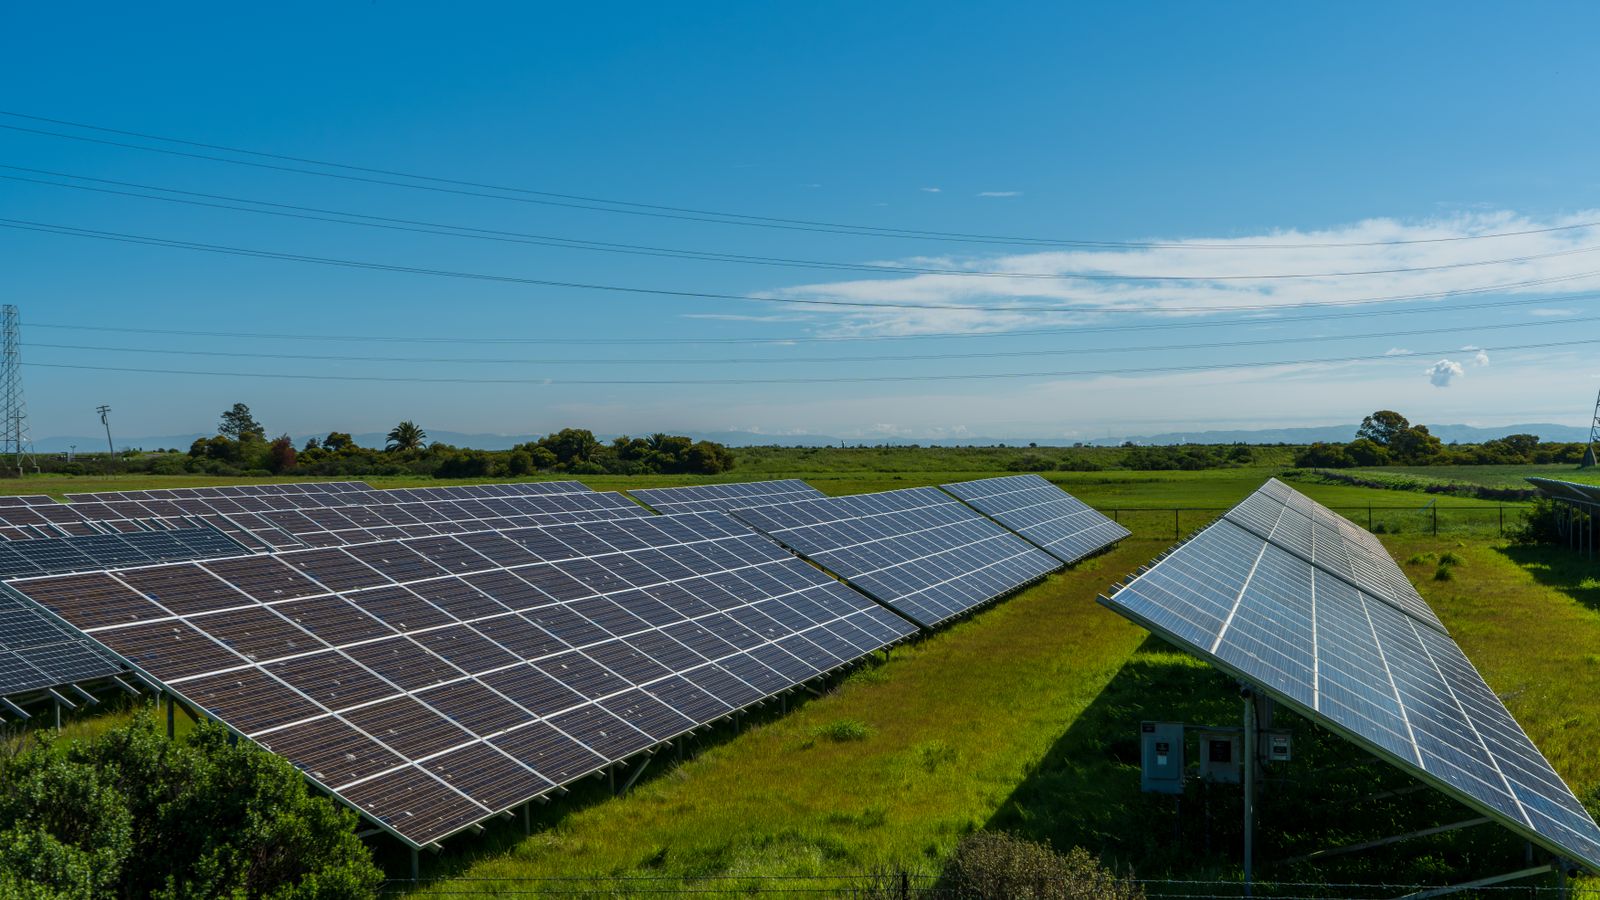
Harlan Grove Farms, Wasco. 1,120 kW DC fixed tilt at 25 degrees, azimuth 202. Sample project.
CSLB #1071482
C-10 Electrical and B General Building (sample)
NABCEP certified
Four PV Installation Professionals on staff
$5M general liability
Plus $2M umbrella and full workers compensation
Bonded to $10M
Payment and performance bonding for public works
EMR 0.71
Three-year experience modification rate (sample)
Prevailing wage
Certified payroll on every public works project
Who we build for
A packing shed, a warehouse and a pump station all buy electricity, and almost nothing else about them is the same. The load shape decides the design.
Interconnection and permission to operate
Construction is predictable. The Rule 21 queue is not, and it usually sets the energisation date. Here is every stage, who owns it and roughly when it lands.
Eight stages, scroll sideways
Weeks 1 to 3 · SunHarvest, utility responds
A paid report telling us what is already on the circuit before we commit to a design.
Circuit capacity understood before design money is spent
Weeks 3 to 5 · SunHarvest
The formal interconnection application, filed the same week as the building permit set.
Application deemed complete by the utility
Weeks 5 to 9 · Utility
A defined set of pass or fail tests. Pass them all and the project skips the studies entirely.
All screens passed, or routed to supplemental review
Weeks 9 to 20 · Utility, fee paid by owner
A closer look when a screen fails, usually resolving without a full distribution study.
Cleared, conditioned, or escalated to a distribution study
Weeks 6 to 14 · City or county, in parallel
Building and electrical permits, running alongside the utility process rather than after it.
Permit issued
Weeks 14 to 22 · Owner signs, utility countersigns
The contract that sets the export arrangement and any conditions from the review.
Agreement executed by both parties
Weeks 22 to 26 · AHJ, then utility
The building inspector signs off, then the utility verifies the protection settings.
Green tag from the AHJ and a passed witness test
Weeks 26 to 30 · Utility
The letter that lets you close the breaker. Until it arrives, the system stays off.
PTO letter issued and the system energised
What each screen tests, what fails them, and what we change when one does.
Interconnection guideDemand charges and time of use
Energy charges are billed per kilowatt hour for what you used. Demand charges are billed per kilowatt against your single highest 15-minute average in the month. An array cuts kWh reliably. Only storage or load control reliably cuts kW.
Modelled monthly effect
Energy charge saved
All 81,000 kWh generated is consumed on site
$15,147
Exported energy credited
0 kWh exported at $0.048
$0
Peak demand charge saved
250 kW shaved for 2.0 hours
$5,600
Time-of-use arbitrage
500 kWh shifted on 21 weekdays
$1,573
Total modelled monthly saving
$22,320
About $267,840 a year, before escalation.
Where the saving comes from
Built and metered
Every project below lists array size in kW DC, inverter capacity in kW AC and modelled annual production in kWh. Sample figures for a demonstration site.
Six projects, scroll sideways
Cold storage and packing · Delano, CA
500 kW / 1,000 kWh lithium iron phosphate
Open case fileWater and municipal · Buttonwillow, CA
None; load shifted through reservoir scheduling
Open case fileEducation · Shafter, CA
None; EV conduit stubbed for 12 future ports
Open case fileFood and beverage processing · Tulare, CA
750 kW / 1,500 kWh
Open case fileAgriculture and irrigation · Wasco, CA
No storage
Open case fileWarehousing and distribution · Bakersfield, CA
None; 8 yard-tractor charging ports installed
Open case fileShading and inverter topology
Modules in a string carry the same current, so the weakest one sets the pace. What the shadow looks like, and how it moves, decides whether you need optimisers, microinverters, or just a better row layout.
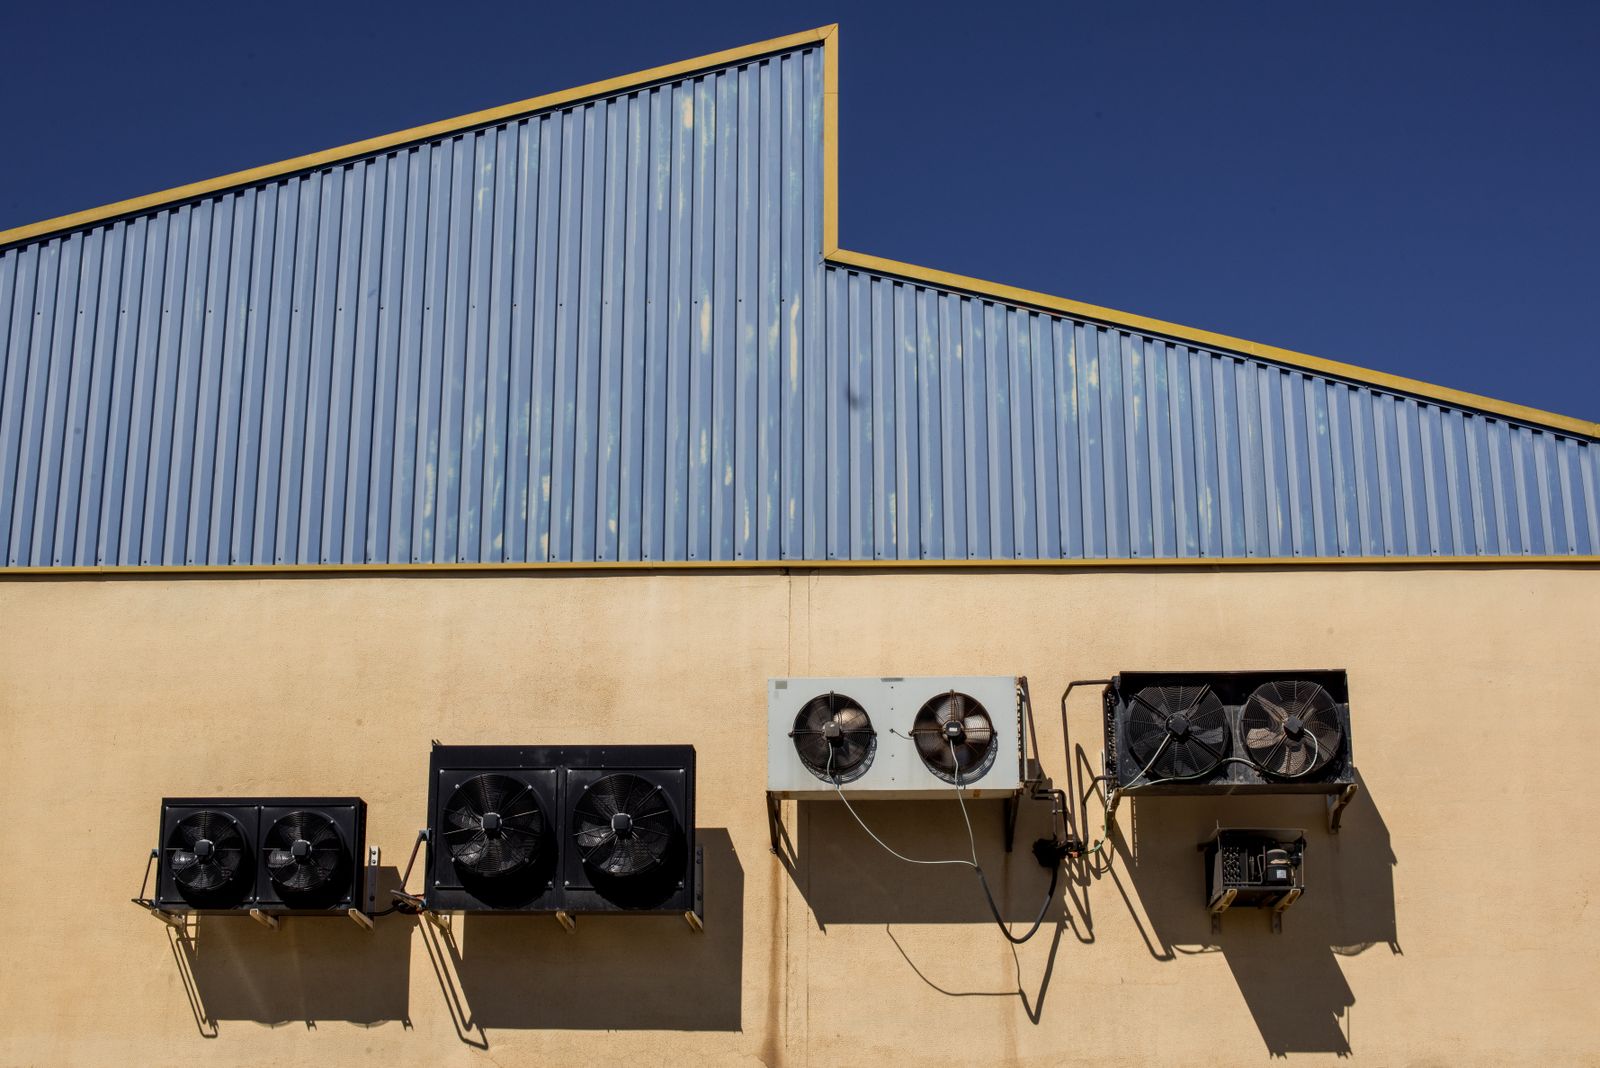
The shadow is localised and moves. Optimisers on the shaded strings recover most of the loss without paying for module-level electronics across the whole array, and they keep the simple, serviceable string architecture everywhere else.
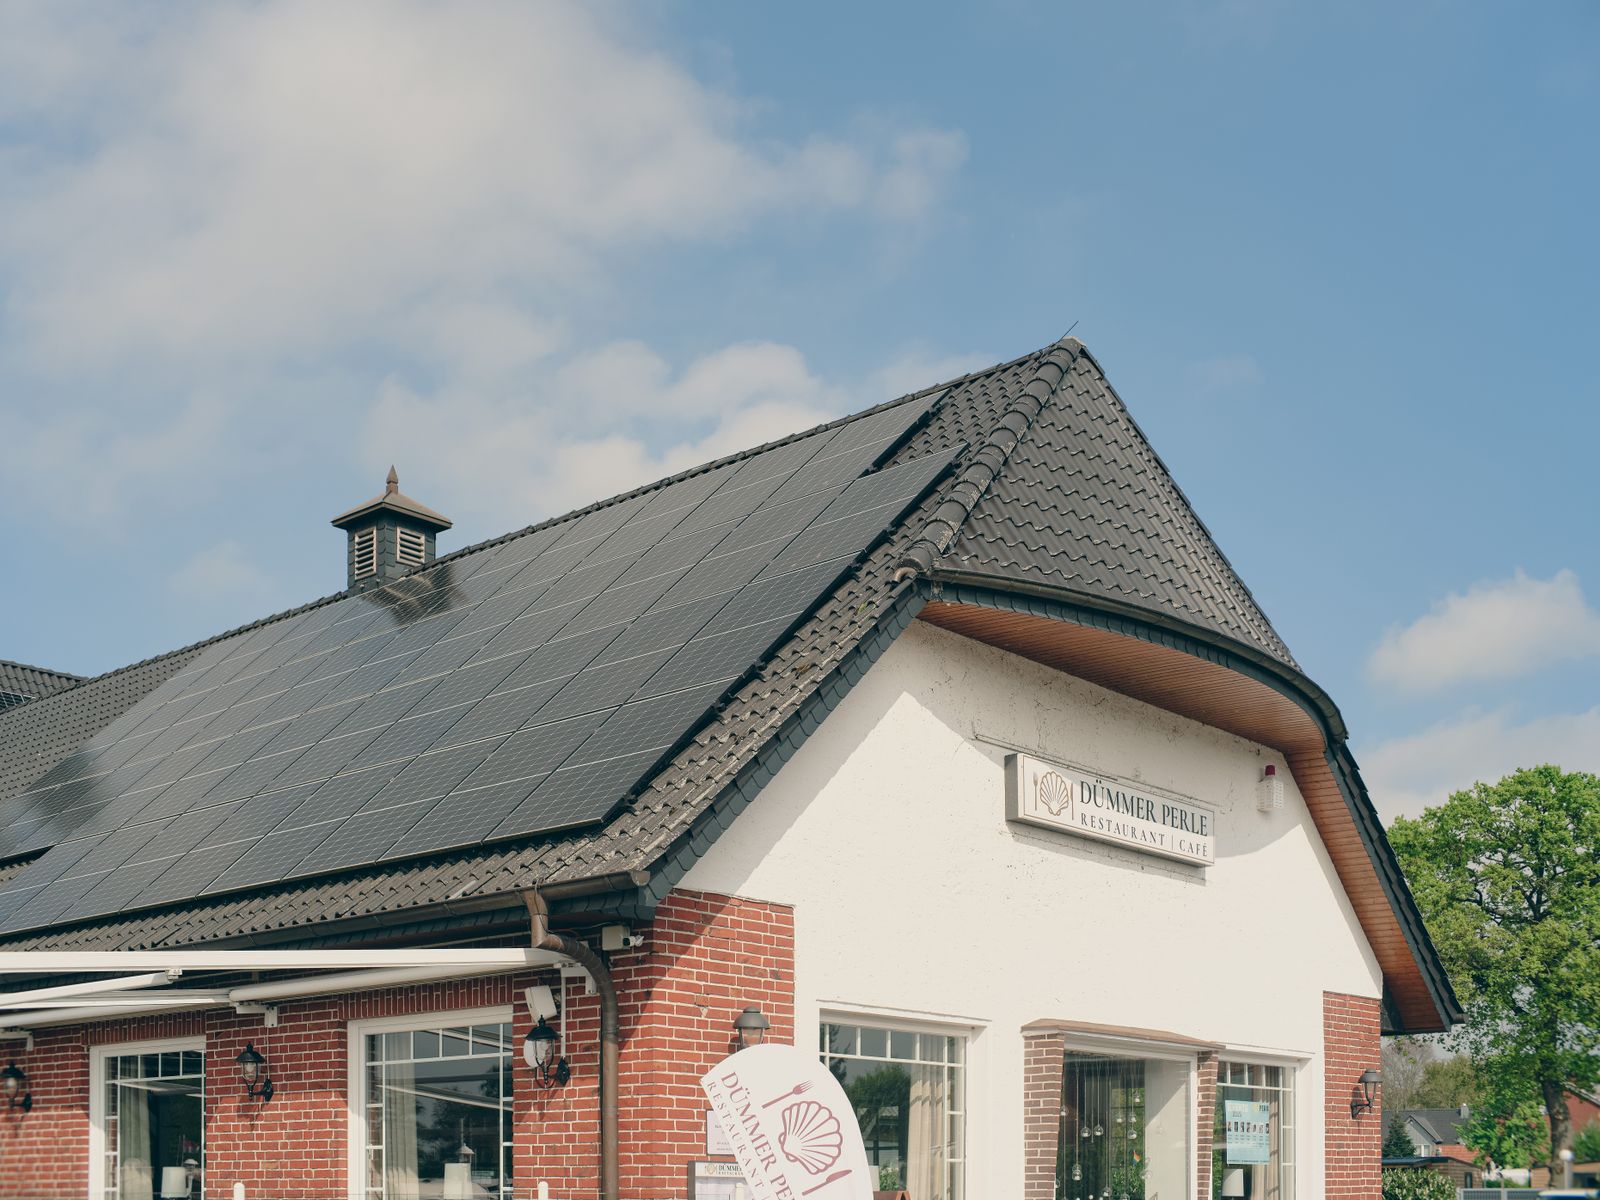
Parapet shade is geometric and entirely predictable, so the answer is layout rather than electronics. We calculate the winter shadow length and start the array beyond it. Electronics cannot recover energy from a module that should not have been placed there.
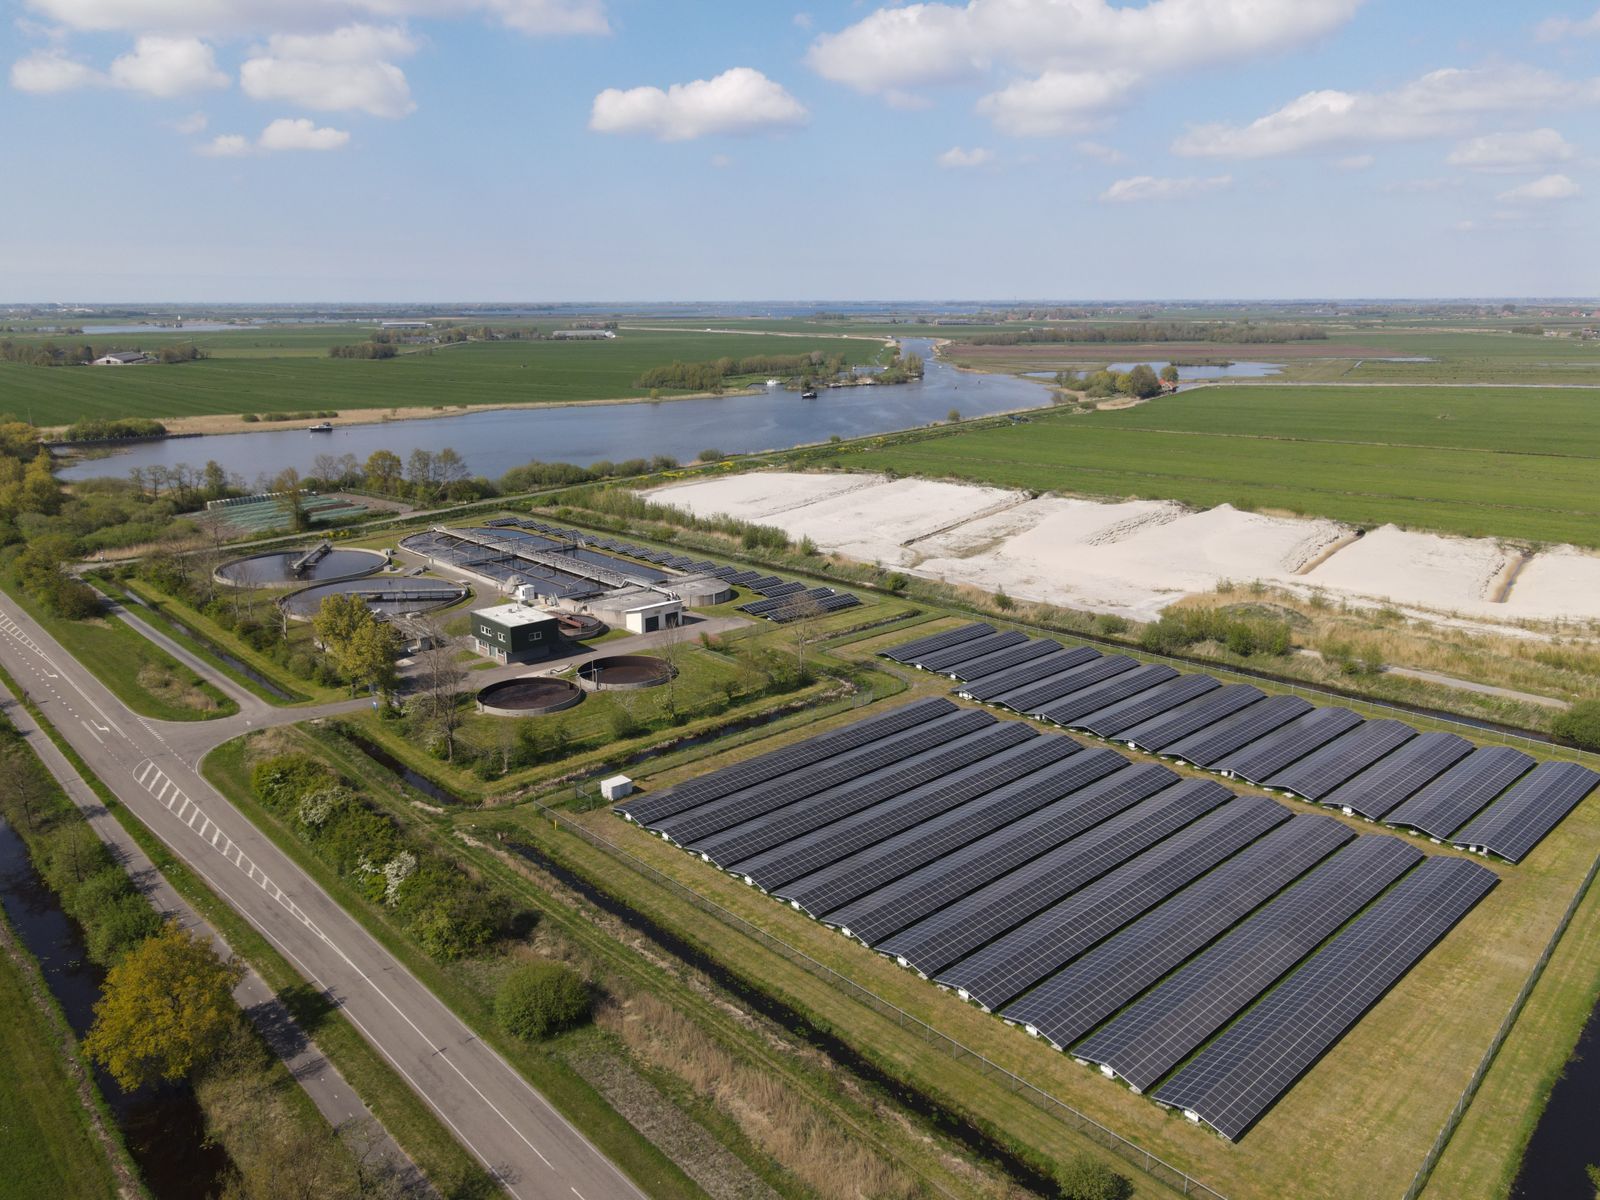
The fix is row pitch and string wiring, not hardware. We space rows against the winter-solstice sun altitude, then wire each string along the row so the whole string dims together rather than one module dragging a healthy string down.
Scattered single-module shading is the one case that genuinely justifies module-level conversion. When the losses are spread across every string, per-string optimisation has nothing clean to protect, and per-module independence recovers the most energy.

The mistake is modelling today's shadow for a twenty-five year asset. We model the mature canopy, set the array boundary against it, and put the trimming schedule in the maintenance agreement so the loss does not creep back in.

Dust builds through a dry season that runs May to October. The lower-edge band is the part that matters, because it can put the bottom cell string into bypass and cost far more than the uniform film alone. It is a maintenance problem, not an equipment problem.
Who turns up
The person who answers your first email is the person who writes your basis of design. Eight of them, based in Bakersfield and Visalia.
Eight people, scroll sideways

Principal Engineer · PE, Electrical
Runs the basis of design on every system over 500 kW. Fifteen years of C&I PV, including four years on utility-scale interconnection studies.

Director of Construction · NABCEP PVIP
Owns the schedule from mobilisation to green tag. Came up through racking crews and still walks every roof before a ballast plan is signed.

Interconnection Manager · Rule 21 specialist
Files every application and chases every screen. Has taken more than ninety projects through supplemental review without a distribution study.

Energy Analyst · CEM
Takes apart interval data and tariffs. Responsible for the demand-charge models and for telling clients when solar is not the answer.

O&M Lead · NABCEP PVIP
Runs the monitoring desk and the wash schedule. Built the soiling model that decides when a Valley array is washed.

Structural Coordinator · CSLB B licence
Handles the roof: membrane condition, dead load, attachment details and the conversation with the roofing manufacturer.

Preconstruction Manager · DBIA Associate
Estimating, procurement and the public works path. Knows which bonding and prevailing wage requirement applies before the bid opens.

Commissioning Technician · NABCEP PVIP
Every string IV traced, every protection setting verified, every baseline documented. If a number is in the handover pack, Wesley measured it.
 Marisol Ibarra, Kern Ridge Packing Co.
What clients say
They spent two weeks in our interval data before proposing anything. The battery is sized for one week in July and that is exactly what our bill needed.
Marisol Ibarra
Plant Manager, Kern Ridge Packing Co. · Delano, CA

An array is an engineering deliverable, not a product. If the numbers only work when you ignore the demand charge, the numbers do not work.
Priya Raghunathan, Principal Engineer
Where we work from
Crews and materials are staged close to the work, so a site visit is hours away rather than a day.
Four locations, scroll sideways





Every project starts with twelve months of interval data and a load shape. The array comes after that, sized to what you actually use.
CSLB #1071482 (sample). Prevailing wage on public works. Engineers answer, not a call centre.
How it goes from here
Design and construction run to plan. The utility queue does not, which is why we file the interconnection application in the same week as the permit set and report on it every month.
01
Interval data and audit
Weeks 1 to 3
Twelve months of 15-minute data pulled, load shape built, peak events attributed to equipment, tariff modelled.
02
Engineering and basis of design
Weeks 4 to 8
Layout, yield model, structural calculations, single line, protection scheme and the storage sizing if any.
03
Permitting and interconnection
Weeks 6 to 22
AHJ plan check and the Rule 21 path, filed in parallel. This is where the schedule is won or lost.
04
Construction
Weeks 16 to 28
Civil, structural, racking, modules, DC and AC electrical, phased around your operating hours.
05
PTO and handover
Weeks 28 to 32
Utility permission to operate, monitoring credentials, as-builts, warranty registry and the O&M calendar.
Start here
Four short steps. An engineer replies within one business day, and the first thing they will ask for is your interval data.
We value your privacy
We use cookies to run this site, remember your preferences and understand how it is used.Cookie policy