Solar and charging share infrastructure
If the canopy or array is already there, the service, the switchgear and the conduit path are largely paid for.
Commercial solar EPC since 2014
Kern County / Tulare County / Kings County / Fresno County
(661) 555-0183Solution
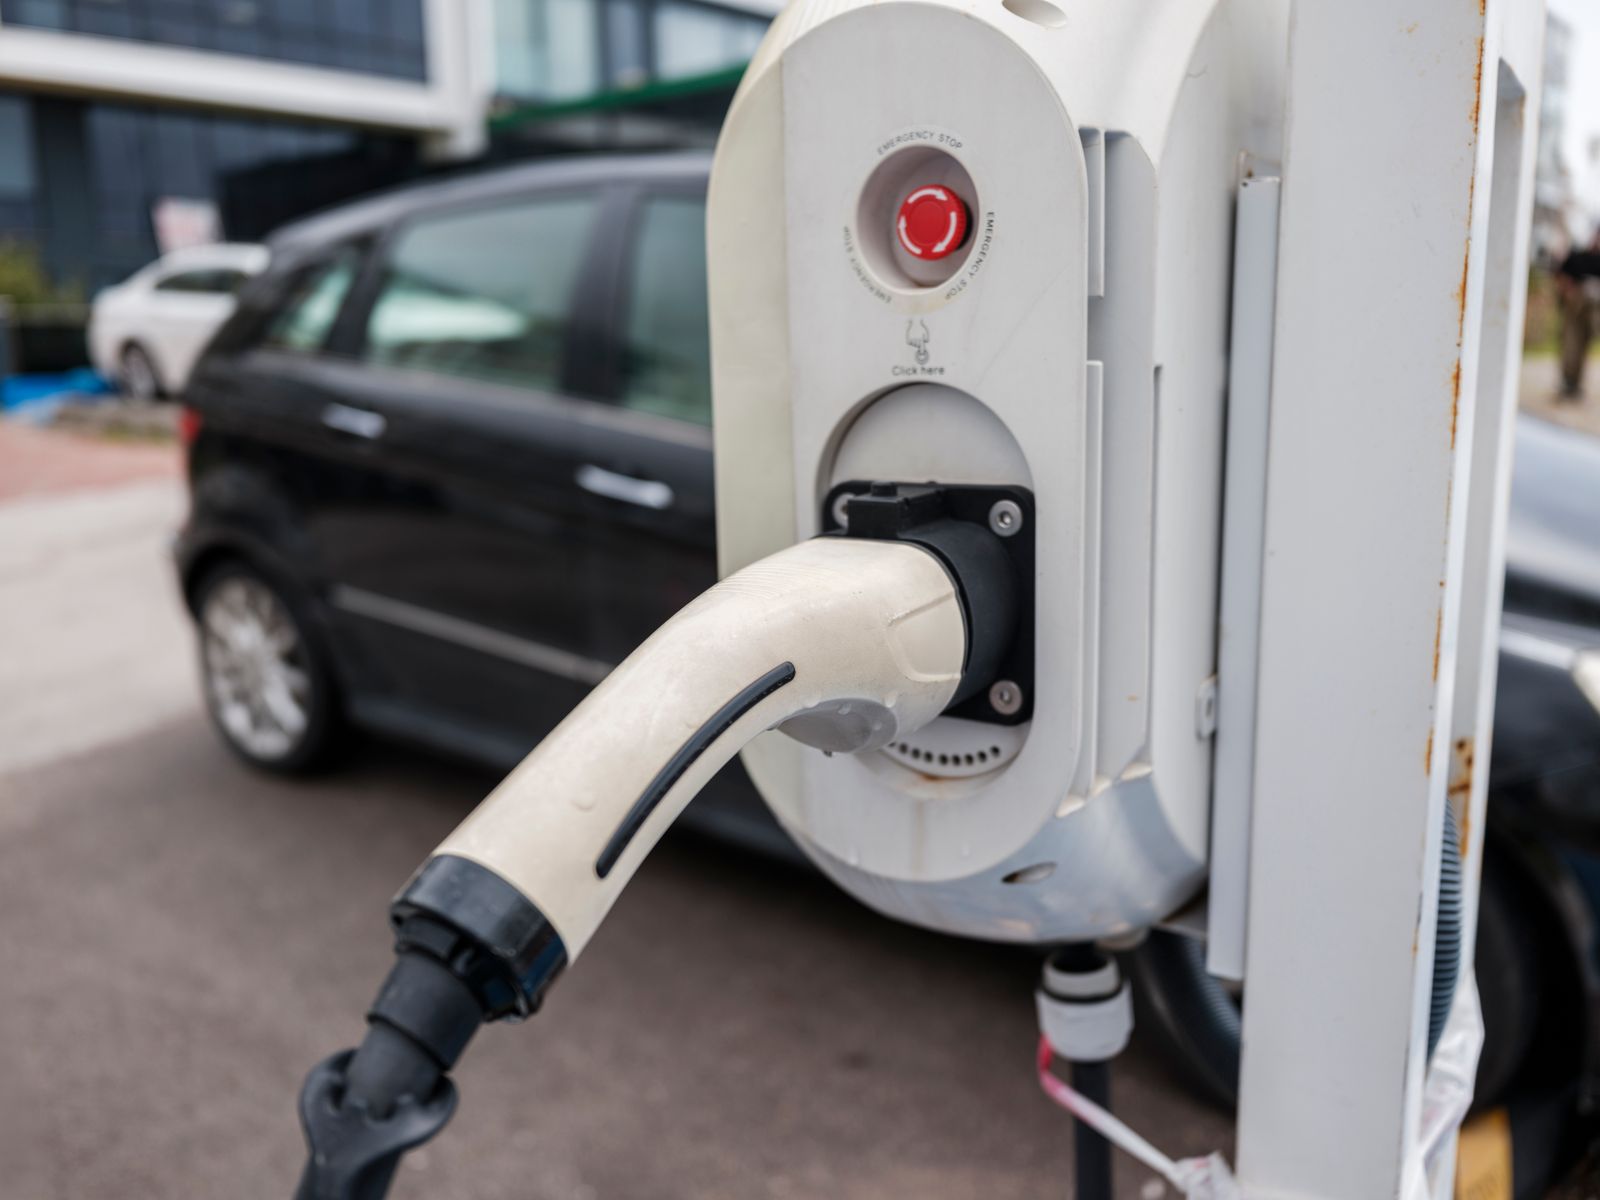
EV charging is an electrical service problem wearing a sustainability badge. The question is never how many chargers you want. It is how many amps your service has left after the compressors start.
Overview
Start with the load calculation. A single Level 2 port at 48 A continuous needs 60 A of dedicated capacity under NEC continuous-load rules. Ten of them is 600 A before anything else in the building turns on. A 150 kW DC fast charger is a different order of problem again.
Most sites do not have that capacity idle, so the real work is load management: charging scheduled to overnight hours, power sharing across ports so a bank of chargers draws a capped total, and in some cases a battery buffering the DC fast chargers so the service never sees the spike.
Fleet depots are the cleanest case because dwell time is long and predictable. A school bus yard with 18 buses parked from 4:30pm to 6:00am rarely needs high-power charging at all: it needs enough energy delivered across thirteen hours, which is an energy problem in kWh, not a power problem in kW.
Demand charges are the trap. An uncontrolled bank of chargers that all start together at 5:00pm can set a new monthly peak on day one and hand you a demand charge that swamps the fuel saving. Load management is not a nice-to-have on a commercial tariff.
Scope of supply
Sequence
Measured demand, spare capacity, and the honest answer about whether a service upgrade is in play.
Vehicles, daily miles, efficiency in kWh per mile, dwell window. That gives the kWh, which gives the kW.
Scheduling, power sharing and caps, designed to keep the site off a new demand peak.
Trenching, conduit, switchgear, bollards and ports, usually phased around fleet operations.
Every port tested under load, schedules loaded, and the yard team trained on what to plug in when.
Why it works
If the canopy or array is already there, the service, the switchgear and the conduit path are largely paid for.
Off-peak energy rates and a flat, managed draw keep both the energy charge and the demand charge down.
Conduit, panel space and switchgear sized for the five-year port count means the next phase is a pull, not a dig.
Make-ready programmes and fleet grants both want a documented load study and a site plan. You will have both.
What moves the price
| Factor | Effect on the project |
|---|---|
| Spare service capacity | The difference between a sub-panel and a full service upgrade, which is a long-lead utility item |
| Dwell time | Long dwell lets you use cheaper Level 2 ports; short dwell forces DC fast charging and its costs |
| Trenching distance | Distance from switchgear to the parking stalls is a straight civil cost, often the largest single line |
| Simultaneity | Whether every port can draw full power at once, or power sharing caps the bank, changes the whole design |
| Demand charge exposure | Uncontrolled charging can create a new monthly peak that costs more than the fuel it replaced |
Often paired with
 Solar carports and canopiesShade structures that carry an array, an EV feed and a lighting circuit.Open
 Battery storage and demand managementDemand shaving, time-of-use shifting and backup for the circuits that matter.Open
 Energy audits and load studiesInterval-data analysis before anyone draws an array.Open
Answers
Not covered here? Our engineers answer directly, not through a call centre.
Ask a question(661) 555-0183A 48 A continuous port requires a 60 A circuit under NEC continuous-load rules, roughly 11.5 kW at 240 V. Ten uncontrolled ports is about 115 kW of new demand. With power sharing you can cap that bank far lower and still deliver the same kWh overnight.
Only if dwell time is short. A fleet parked for twelve hours overnight almost never does. Level 2 delivers plenty of kWh across that window at a fraction of the equipment and service cost.
Partly. Solar produces at midday and most fleets charge overnight, so without storage the array offsets the kWh on the bill rather than physically filling the buses. Add storage and the overlap improves considerably.
This is the number one reason fleet charging projects disappoint. We model your demand charge before and after, and we design the control strategy to hold the new peak below your existing one wherever the dwell window allows it.

Every project starts with twelve months of interval data and a load shape. The array comes after that, sized to what you actually use.
CSLB #1071482 (sample). Prevailing wage on public works. Engineers answer, not a call centre.
We value your privacy
We use cookies to run this site, remember your preferences and understand how it is used.Cookie policy