Right-sized, not over-sized
An array matched to your load shape keeps more of its output on site, where each kWh is worth the full retail rate.
Commercial solar EPC since 2014
Kern County / Tulare County / Kings County / Fresno County
(661) 555-0183Solution
Half the commercial proposals we see are sized from an annual kWh total and a rule of thumb. That is how a facility ends up exporting at a low credited rate all morning and paying a demand charge at seven in the evening.

Overview
Your utility already holds 15-minute interval data for your meter. It is the most useful document in the project and it costs nothing. We pull twelve months of it and build the load shape: what you draw, hour by hour, season by season.
That shape answers the questions a monthly bill cannot. When is the peak, and what causes it? How much of midday generation would be consumed on site rather than exported? Is the demand charge driven by a sustained process load or by one motor starting? Does the load collapse at weekends?
Then we work the tariff. Commercial rate schedules have time-of-use periods, seasonal changes, separate summer and winter demand charges and sometimes a non-coincident demand component. Putting the load shape against the tariff tells you which kWh are worth chasing and which are not.
Frequently the audit finds savings that need no solar at all: a compressor staged differently, a chiller sequence changed, a pump running against a throttled valve. Those get reported plainly, even when they shrink the array we would otherwise sell you.
Scope of supply
Sequence
We request your interval data and the last twelve bills. Usually a signed release is all it takes.
Build the profile, isolate peak events, and attribute them to equipment where the data allows.
Half a day on site tying the data spikes to the actual machines that cause them.
The load shape run against your current rate and the plausible alternatives.
A written report with the operational fixes first and the generation recommendation second.
Why it works
An array matched to your load shape keeps more of its output on site, where each kWh is worth the full retail rate.
You find out exactly which events set your monthly peak, which is the only way to know whether storage will help.
Scheduling and sequencing changes cost little and often land before the solar project is even approved.
Lenders, boards and grant programmes all respond better to measured interval data than to a rule of thumb.
What moves the price
| Factor | Effect on the project |
|---|---|
| Data availability | Some meters only report monthly. Where interval data is missing we install temporary logging |
| Seasonality | Harvest, crush and cooling seasons distort the year. Twelve months is the minimum useful window |
| Process variability | Facilities with changing product mixes need the load attributed to process, not just to the clock |
| Tariff complexity | Multiple meters, separate agricultural schedules and standby charges all change the answer |
| Planned changes | A new cold room or a fleet of electric vehicles changes the load shape and must be modelled now, not later |
Often paired with
 Battery storage and demand managementDemand shaving, time-of-use shifting and backup for the circuits that matter.Open
 Commercial rooftop solarBallasted and attached arrays on TPO, BUR, standing seam and R-panel roofs.Open
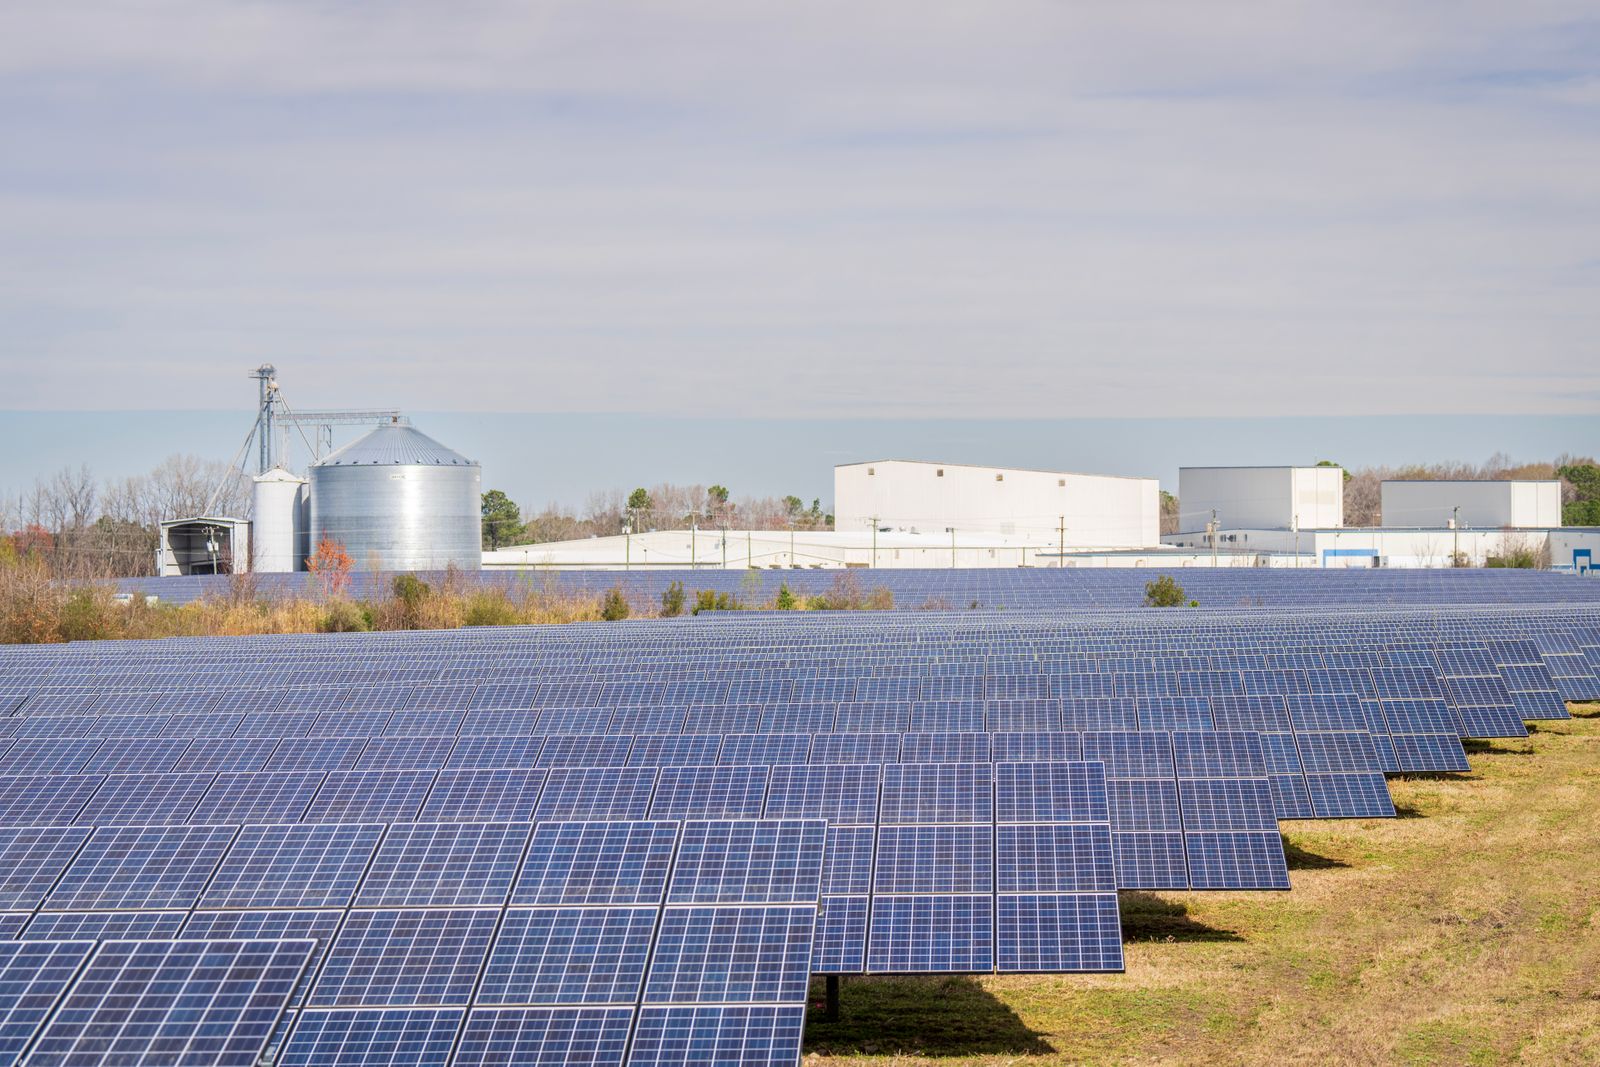 Ground-mount solar farmsFixed-tilt and single-axis tracker fields on marginal or fallowed ground.Open
Answers
Not covered here? Our engineers answer directly, not through a call centre.
Ask a question(661) 555-0183Usually yes. Most California utilities give commercial customers access through the online account, often as Green Button data. If not, a signed authorisation lets us request it on your behalf.
Especially then. Sizing from an annual kWh figure ignores when you use the energy, and on a commercial tariff when matters as much as how much.
If the numbers say so, yes. We have recommended a compressor control change and a tariff switch instead of an array more than once. It is a shorter invoice and a better outcome.
Typically two to three weeks from receiving the interval data: about a week of analysis, a site walk, then the report.

Every project starts with twelve months of interval data and a load shape. The array comes after that, sized to what you actually use.
CSLB #1071482 (sample). Prevailing wage on public works. Engineers answer, not a call centre.
We value your privacy
We use cookies to run this site, remember your preferences and understand how it is used.Cookie policy